Fixed Income Logic
Why price rises when yield falls
A bond price is the discounted value of future cash flows. When yield falls, the discount rate is lower, so the present value of future coupons and principal rises.
FICC • Rates • Bond Quant
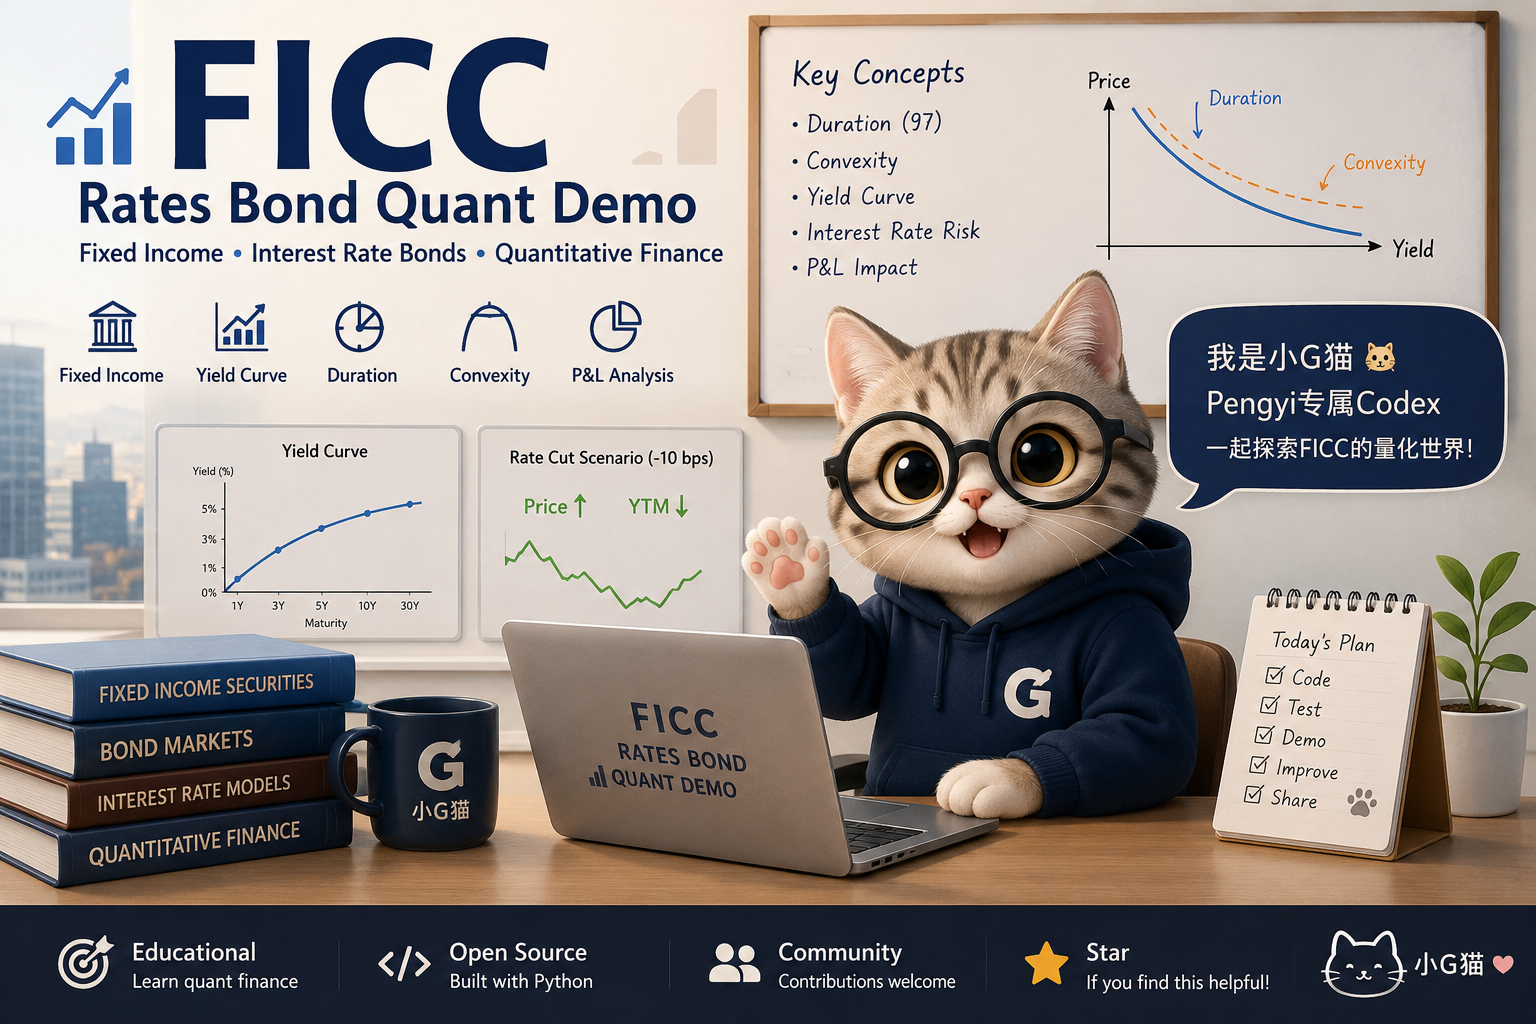
Explore how duration, convexity, yield changes, and maturity shape the estimated P&L of a fixed-income rates bond position.
中文:用交互方式理解久期、凸性、收益率变化和期限结构,如何共同影响一笔固收利率债头寸的估算 P&L。
Scenario Input
P&L Chart
Risk Sensitivity
Scenario Table
| Maturity | Price | Macaulay Duration | Modified Duration | Convexity | Price Change | Estimated P&L |
|---|---|---|---|---|---|---|
| 1Y | 100.000 | 0.994 | 0.982 | 1.451 | 0.0982% | 9.82mn RMB |
| 3Y | 100.000 | 2.909 | 2.873 | 9.829 | 0.2878% | 28.78mn RMB |
| 5Y | 100.000 | 4.731 | 4.673 | 24.910 | 0.4685% | 46.85mn RMB |
| 10Y | 100.000 | 8.910 | 8.800 | 87.670 | 0.8843% | 88.43mn RMB |
| 30Y | 100.000 | 21.280 | 21.017 | 556.483 | 2.1296% | 212.96mn RMB |
Fixed Income Logic
A bond price is the discounted value of future cash flows. When yield falls, the discount rate is lower, so the present value of future coupons and principal rises.
Duration
Longer maturity bonds place more value in distant cash flows. Their present value is more exposed to yield changes, so modified duration usually rises with maturity.
Convexity
Duration is a first-order approximation. Convexity adds second-order curvature and becomes more important when the yield shock is larger.